Don’t hesitate to contact us:
Forum: discuss.graphhopper.com
Email: support@graphhopper.com
We’re happy to announce our new product: the Cluster API! It solves the “capacity clustering problem” by assigning a set of customers to a given number of distinct groups (called clusters). The API “clusters” by minimizing the total distance from each individual customer to its designated group median. It can also consider minimum and maximum capacity restrictions for each group.
Clustering can be used in many practical applications. For example, it can help to design territories for field workers or to solve large vehicle routing problems (VRP). Our experiences with vehicle routing in particular motivated us to implement this API. It helps with some types of problems we cannot solve yet, like the VRP with a minimum number of stops. It even improves the visual attractiveness of the VRP solutions we provide with our Route Optimization API*!
For a visual representation of Cluster API, let’s take a look at this example. There are 490 customers in Munich. Each customer is assigned a demand of 1, represented by the blue dots on the map below.
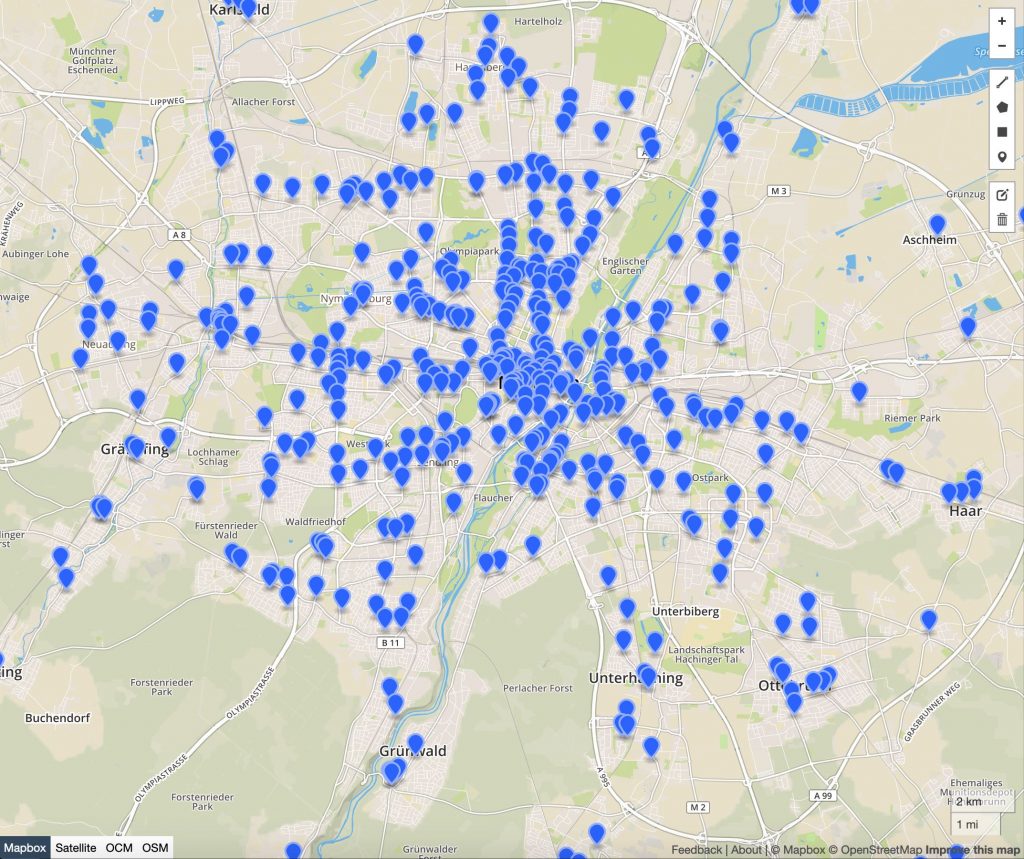
Assume that we can deploy 17 vehicles, thus, we want to assign 490 customers to 17 clusters. The minimum number of customers in a cluster should be 15, however, the cluster size should not exceed 35 customers.
If you post that clustering problem to our API, you will be provided with the following solution:
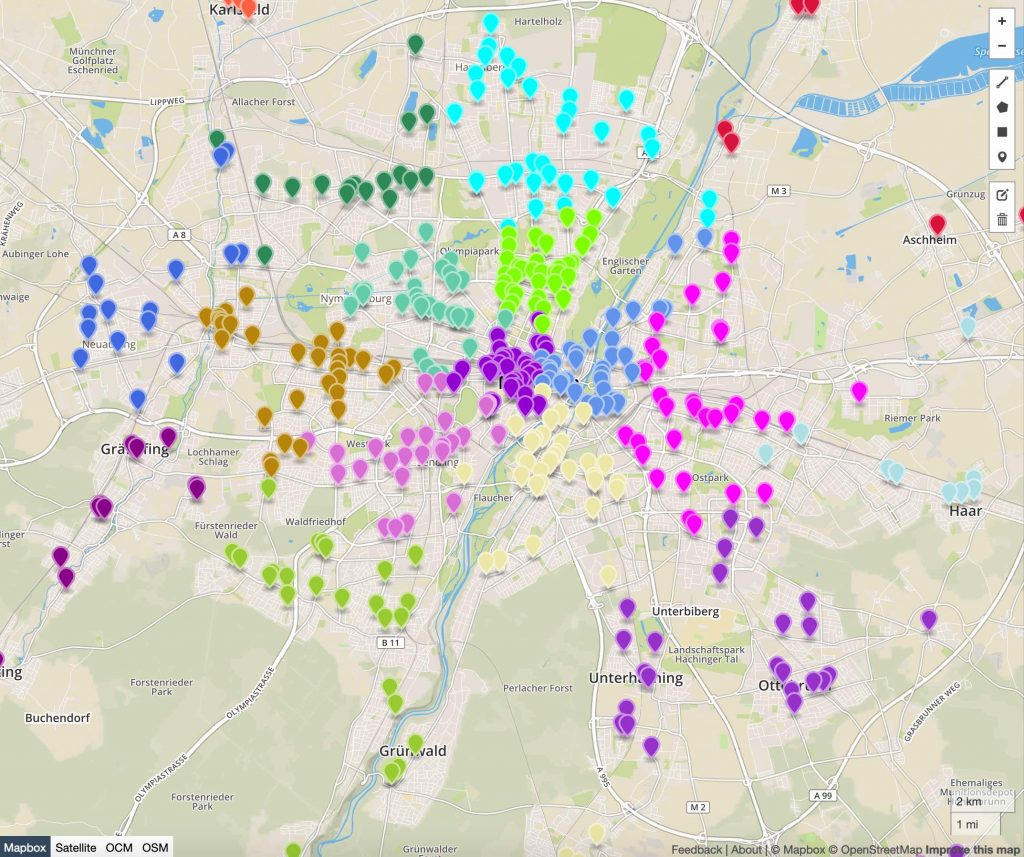
There are two steps to solving the problem. First, the API calculates a travel time and distance matrix between all customers, resulting in a 490 x 490 matrix. Travel times and distances depend on the travel profile selected. You may specify any profile that GraphHopper Maps provides, like “car”, “foot”, “bike”, “small_truck” etc…Second, the API solves the clustering problem based on this generated matrix.
Do you want to solve your own clustering problem? You can learn how to do it with a slightly more technical article and our comprehensive documentation – find out more at graphhopper.com.
Happy clustering!
Note: You can find the entire example here and with a valid API key see and analyze the solution directly on the map.
*If you think visual attractiveness doesn’t matter, let me quote Rossit et al. (2019): “Enhancing visual attractiveness in a routing plan has proven to be an effective way to facilitate practical implementation and positive collaboration among planning and operational levels in transportation.” I recommend their comprehensive review, here Visual attractiveness in routing problems: A review.
