Don’t hesitate to contact us:
Forum: discuss.graphhopper.com
Email: support@graphhopper.com
We have polished the dashboard for our Directions API. Especially the usage statistics are much prettier now. You can now view the credit usage per API key very nicely in a bar chart or just download it completely. Have fun analyzing your usage statistics! Your GraphHopper Team


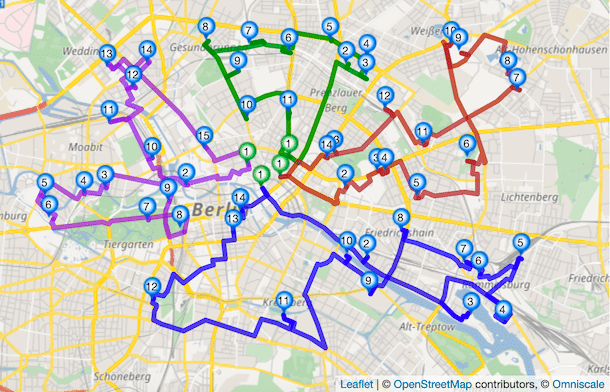
Suppose you have 50 deliveries and you hire four drivers to make those deliveries. Each driver is either paid for a certain number of hours or is paid for a certain number of jobs. In this case, you wouldn’t necessarily want one driver to get all 50 deliveries, even if this minimizes the total variable […]

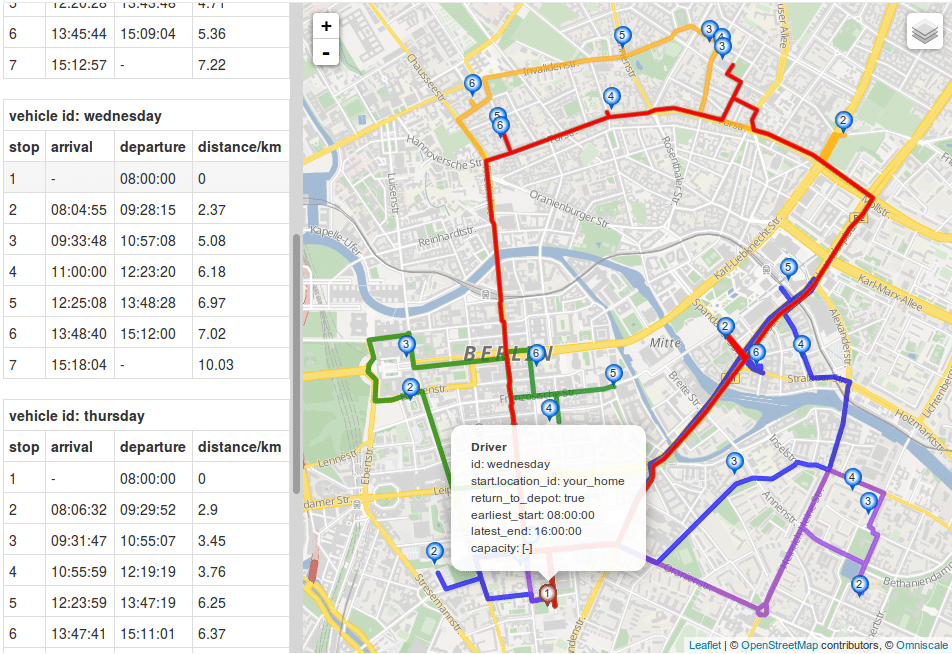
Introduction A few years ago, we wrote a tutorial to show you how to model a traveling salesman problem with a week-planning horizon. Since then we have been improving our API a lot and I would like to show you how easy it is now to model this with driver shifts. For example, suppose you […]

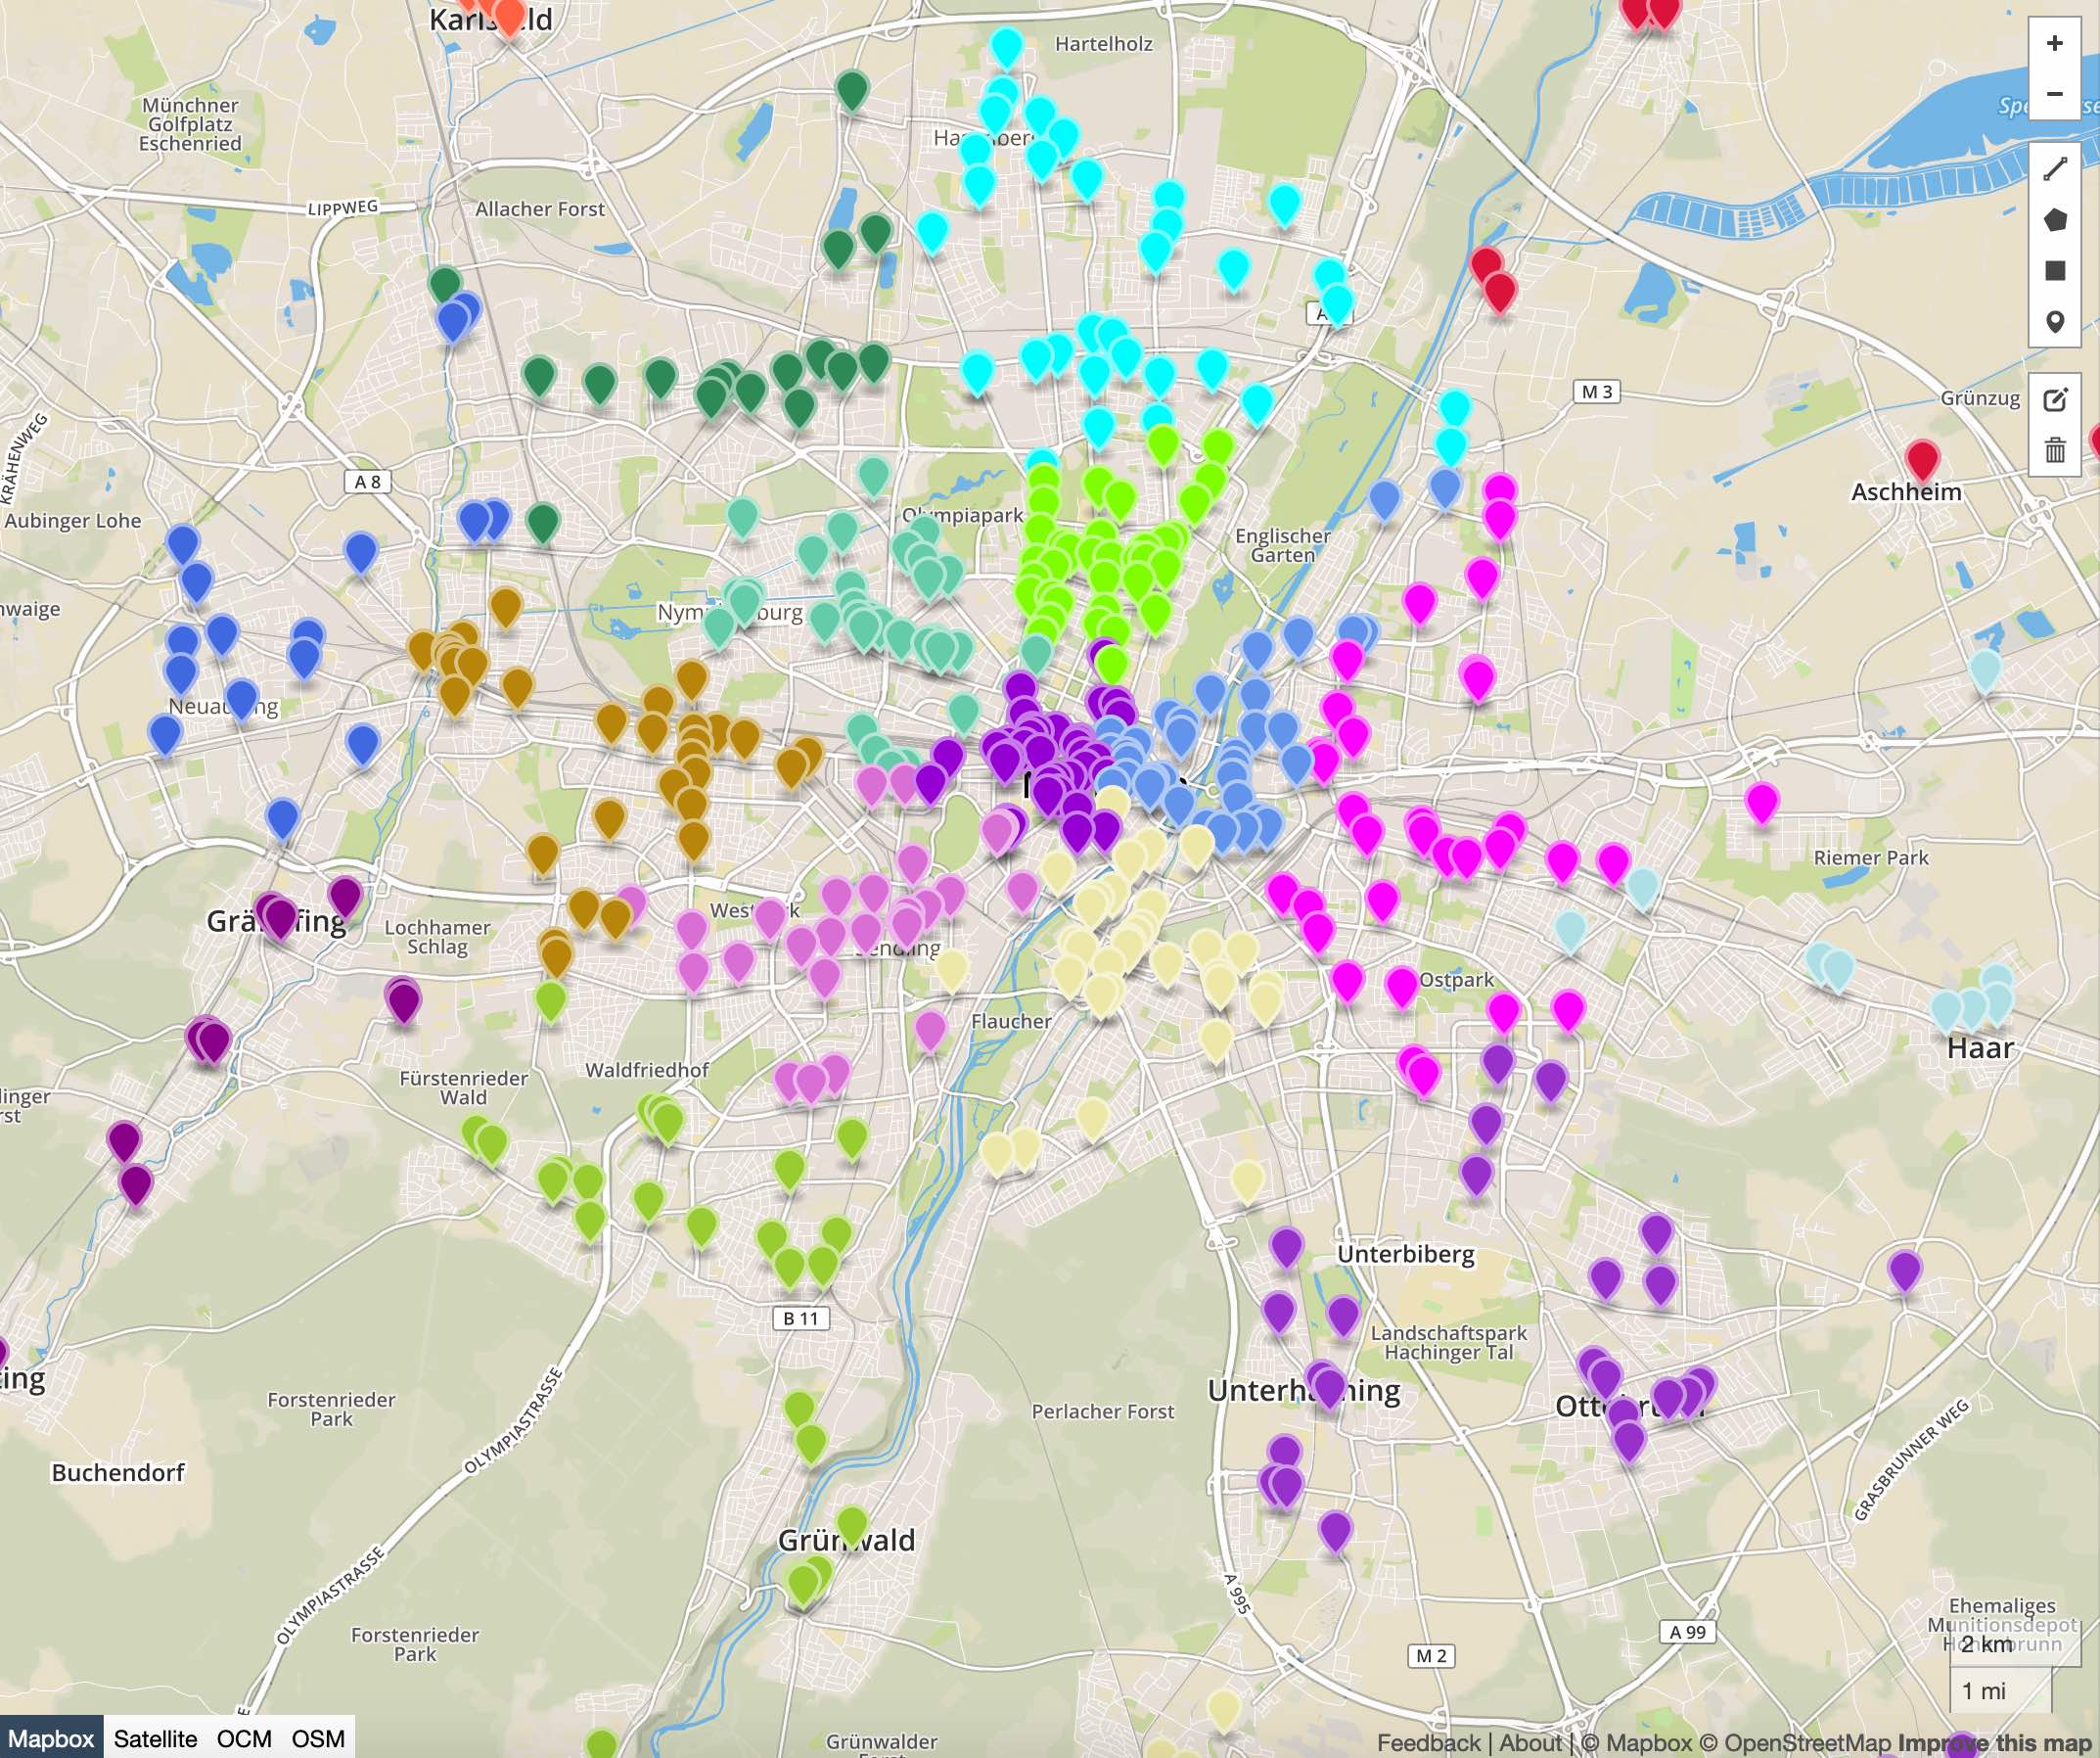
We’re happy to announce our new product: the Cluster API! It solves the “capacity clustering problem” by assigning a set of customers to a given number of distinct groups (called clusters). The API “clusters” by minimizing the total distance from each individual customer to its designated group median. It can also consider minimum and maximum […]
The Route Optimization API works via an HTTP endpoint and you POST a JSON document to https://graphhopper.com/api/1/vrp?key=[YOUR_KEY] This requires an API key that you can get here: login and go to API keys and generate an API key by clicking the Add API key button. Copy it and paste it to [YOUR_KEY]. Let us start […]