Don’t hesitate to contact us:
Forum: discuss.graphhopper.com
Email: support@graphhopper.com
GraphHopper is used for many use cases and various companies around the globe have integrated it to provide outdoor trip planning for their customers. They all rely on precise elevation data: be it for displaying purposes, statistics regarding the incline, for bike routing to avoid hills or to better estimate energy usage of electric vehicles.
Up until now we used the 90m precise elevation data of CGIAR a derivative of the NASA project (SRTM) and it served us well, but from time to time customers demanded more precise elevation data. Especially near mountains and along rivers the elevation errors were sometimes too high, because of a too low resolution which could sometimes even cause detours around those (non-existent) obstacles. Less precise elevation data means each cell with a single elevation value is relatively large (e.g. 90m x 90m instead of 30m x 30m). When a cell from a steep mountain incline overlaps part of a road, the road its elevation can suddenly spike to match the mountain, although the road itself doesn’t climb.
Obtaining better and open elevation data with a global coverage is still a challenge, because there are many sources that publish them and it can get tricky to combine them and get elevation data usable for commercial usage. Over the last years there were a few approaches, but none of them satisfied our needs due to a lack of global coverage or they were too restrictive for commercial usage.
With the mapterhorn project we decided to give this another try as this is the first project that has global coverage in mind as well as commercial usage. Over the last weeks we successfully integrated this data into our routing engine. (Scroll down for some examples.) This was a challenging undertaking because we had to handle a lot more data, which would have caused a massive slow down of the OpenStreetMap import pipeline if processed in a similar fashion.
One part of the solution was to optimize the OpenStreetMap import pipeline and another part was a new compressed cache format that stores small 16×16 blocks in a delta encoding fashion. But only one starting value is used for the entire block (“base value”) so that accessing the data is fast, requiring only three reads: the pointer into the block, the base value, and the offset value itself. The compression ratio is approx. 50% and more importantly the read speed is slightly faster than without this compression for our use case, likely because a more compact memory representation reduces I/O by lowering the amount of data that must be transferred between disk and RAM. As the available physical memory is by far exceeded, we rely on memory-mapped files to let the operating system handle page loading and eviction (virtual memory).
All approaches to speed up this import process had to be tested for planet-wide scale as smaller data sets lead to different results. And so every small change took several hours until we knew if it achieved the result we wanted or not. And we had to parallelize several tests and so we invested several weeks of CPU time for these tasks.
After this was done we saw a few opportunities to improve GraphHopper Maps to better show this new elevation data and also show the elevation on the mobile version. One important change was a more powerful elevation widget:
that directly shows the incline.
The second important change was the introduction of route statistics available under “Details” for every route:
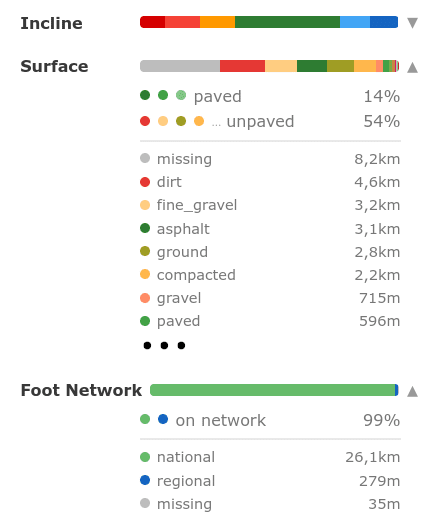
Giving you valuable insights regarding incline, surface or bike/foot networks. Especially when alternative routes are given or you open multiple tabs with different via points this is a nice way to explore your routes. More about these improvements in another blog post.
Now a few example will follow where you can immediately see how and where the new elevation data is a nice improvement.
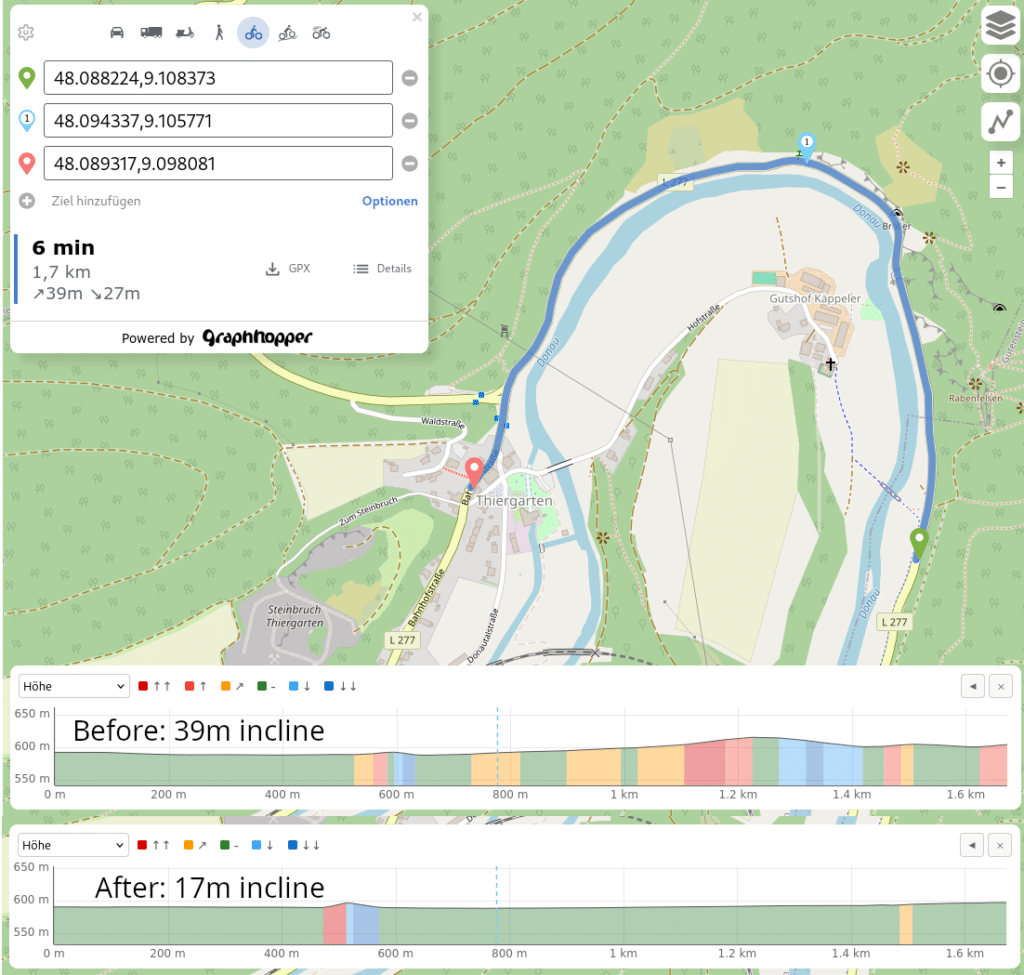
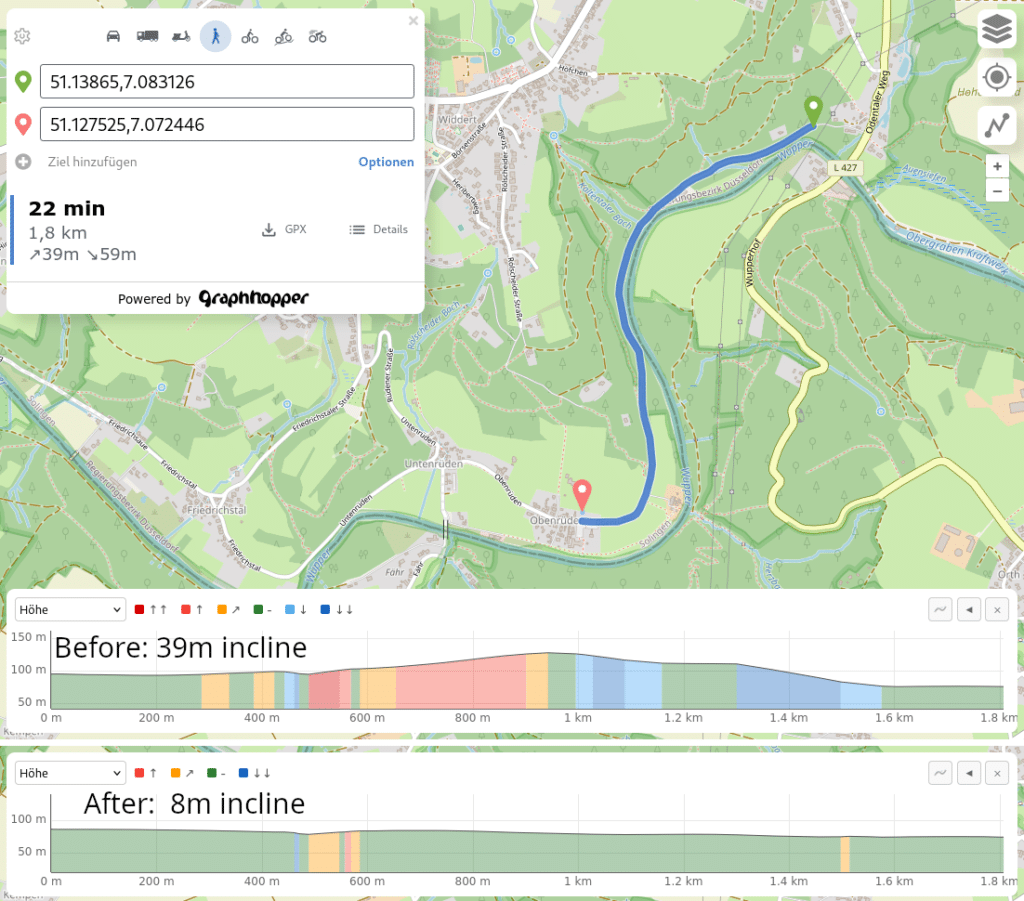
The first example is a typical case where a road is close to a river with nearly no elevation change, but it is also close to a mountain with a steep incline leading to bigger artifacts for less precise elevation data:
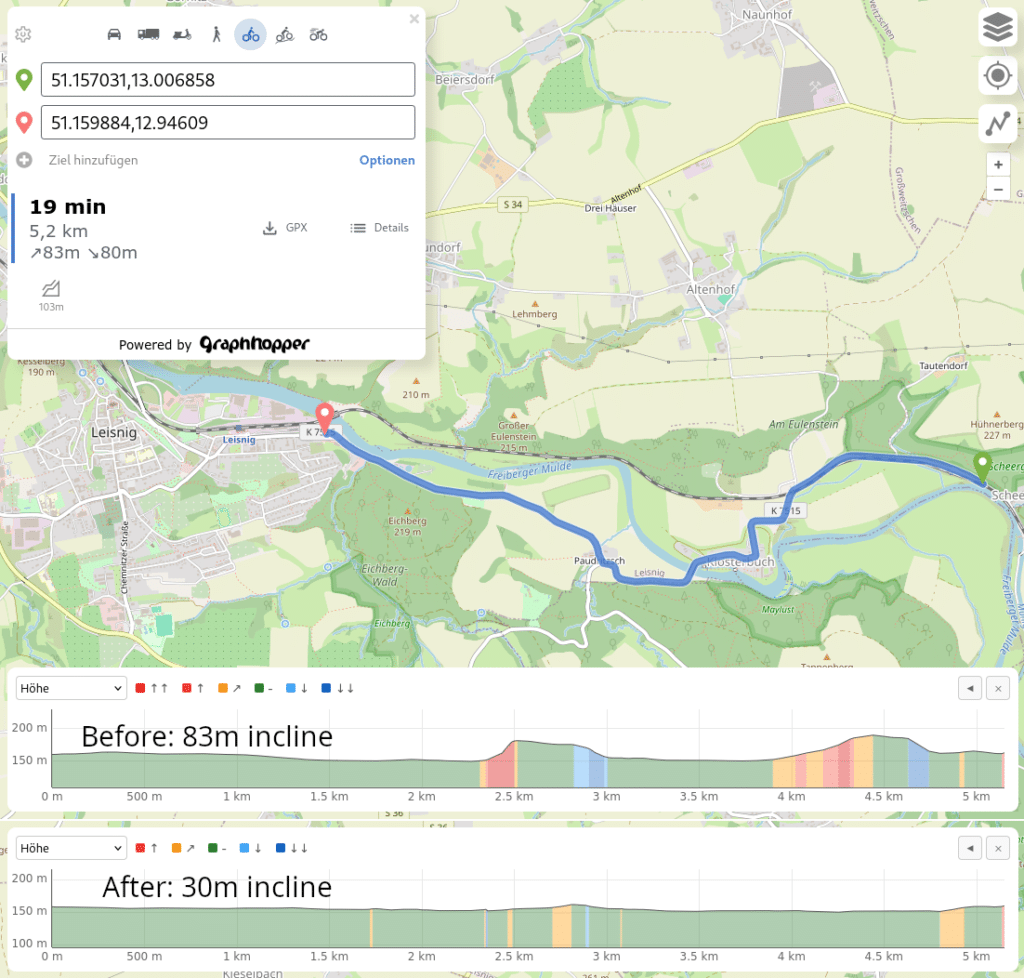
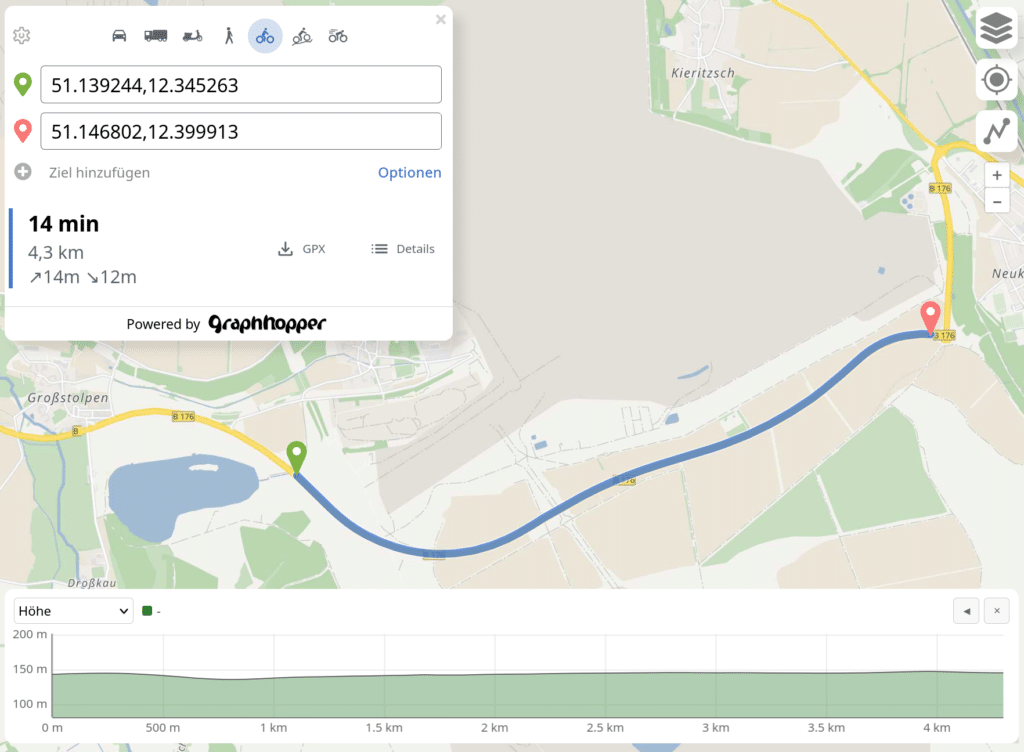
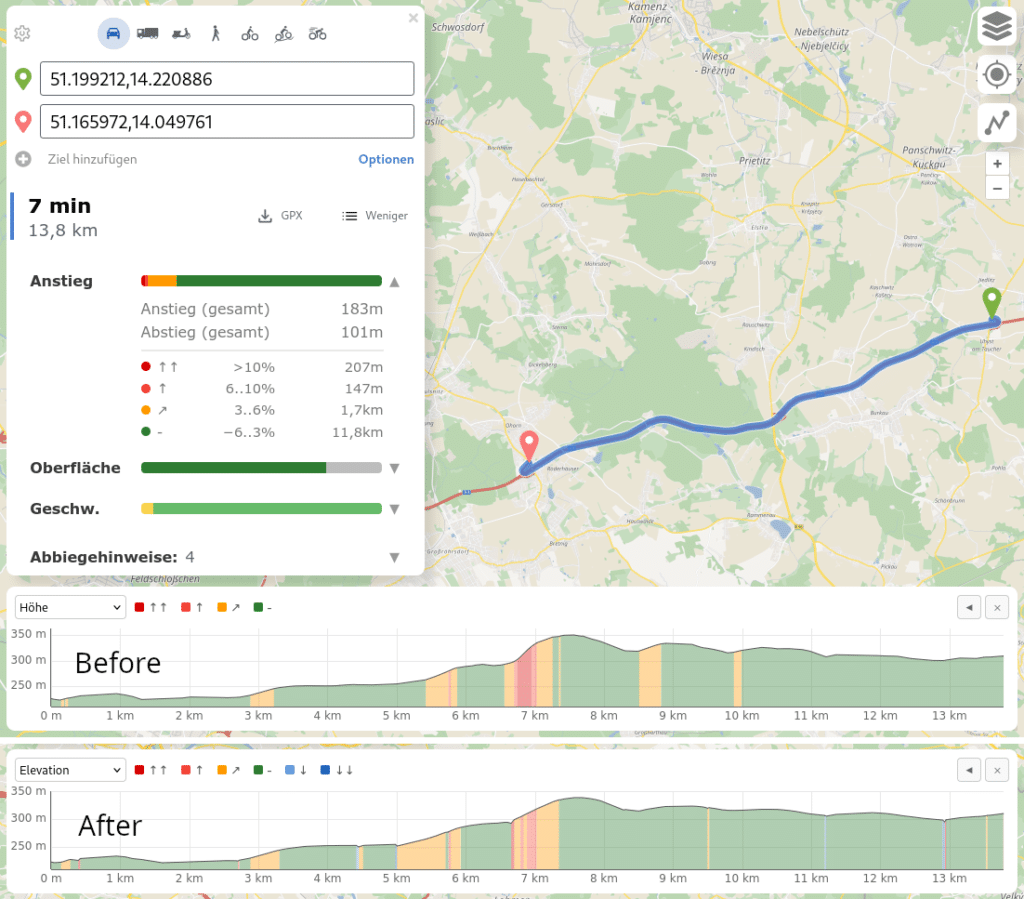
The second example is a road around a few smaller hills and you can see how the more precise elevation data form a completely different picture of the route ahead:
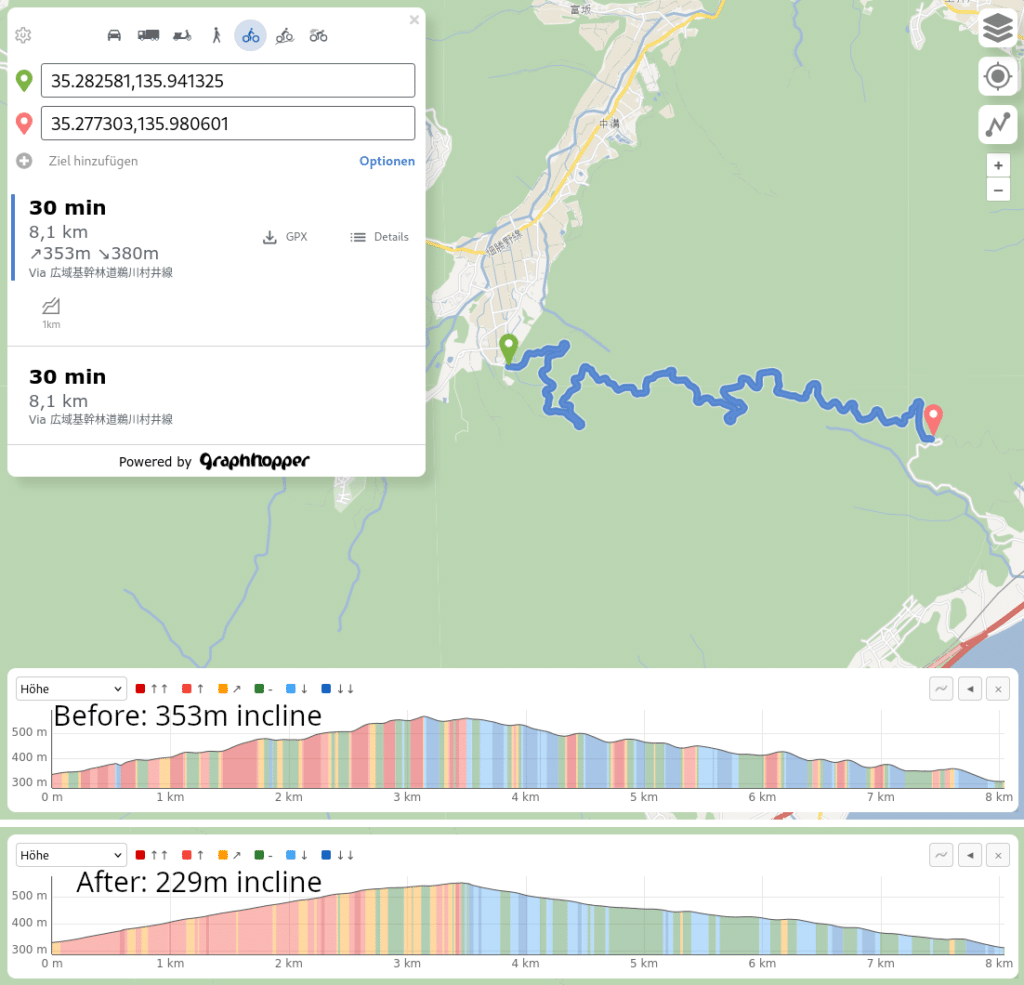
The third example is a road on a mountain in Japan that looks a bit like steps with the less precise elevation data:
The fourth example shows that this elevation data improvement is of course also beneficial for hiking routes:
The fifth example shows a tricky route where a popular bike routing service shows an extreme decline and incline (+-90m) in the middle of the route although there is nothing. However, our approach is different and does not produce such extreme artifacts:
The last example illustrates that better elevation data is also important to get improved energy estimates for electric cars:
This new elevation data from mapterhorn is already live for all APIs of our commercial offering since a few weeks.
So happy routing and try it out in GraphHopper Maps!

