Don’t hesitate to contact us:
Forum: discuss.graphhopper.com
Email: support@graphhopper.com
Today, we would like to show you a demo of a feature we’ve been quietly working on for over a year: Real-time public transit routing.
Grassroots transit apps depend a lot on open data published by operators. Trimet of Portland, Oregon, publishes both their schedule and realtime updates. This is what it looks like when we let GraphHopper answer profile queries on it. Please give it a try.
It is only a demo, and a GUI prototype. You have to zoom in to your routing result by yourself, and we are sure you can totally DOS this server. Please don’t. Also, times are local to where your computer is, not ours or the agency, so if you’re not near the US west coast, make sure you pick a time where it’s not in the middle of the night in Portland.
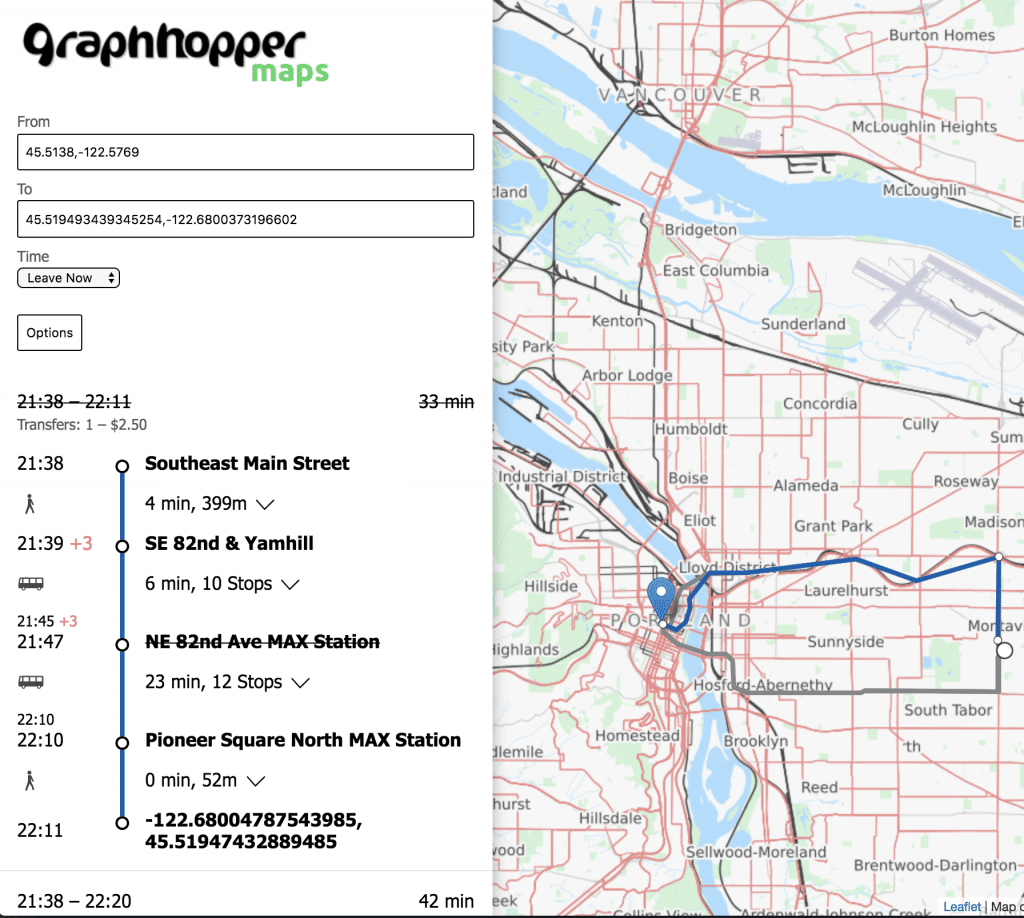
A profile query asks for the list of all itineraries where each one is the best way to get from A to B, for some departure time within a specified time window. Essentially, it is what you would print out and hang next to your door for a destination you frequently visit. Any time you want to leave the house to go there, you would read off the next departure after the current time, and that would be the route to take. In complex transit systems, the profile may contain itineraries on several very different routes.
Notice how the real-time updates come into play: When an itinerary based on scheduled times becomes impossible to reach according to current information, it is still displayed, but crossed out, so that a user who is familiar with the timetable will not be confused about why this connection is missing. And a current alternative, which otherwise would not be part of the profile, is displayed instead.
This happens quite a lot, but not because busses in Portland are late particularly often. This demo uses a rather idealized view of the transport system, where, among other things, transfers happen instantaneously. Consequently, the itineraries you get are much faster than those which Trimet’s actual trip planner will recommend, and this also explains why we see many “missed” connections, as any delay at all will likely cause a “scheduled” transfer to fail. (GraphHopper does support minimum transfer times, we just didn’t add any. It’s beside the point of this demo, and more opportunities for transfers make for more variability in routes and more frequent disturbances by realtime conditions, hence a more exciting test scenario. Realism is up next.)
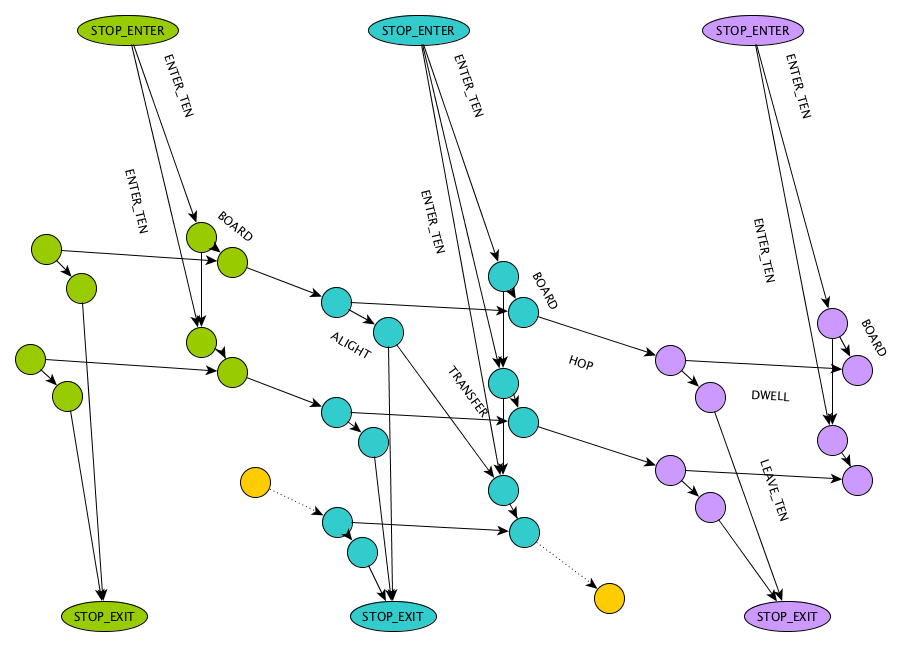
The time-expanded network model for public transit: Edges are events such as riding a bus between two stops, or waiting at a stop. Nodes are decision points. Special enter and exit nodes connect the transit system to the road network.
We use a classical algorithm for transit routing, which blends rather smoothly into our road routing. We extrude the transit network (of stops and connections) into the time-dimension, so that every event of the type “a vehicle goes from one stop to the next” (called an elementary connection) becomes an edge in the graph, and so do all opportunities for passengers to enter or leave vehicles, or to wait at a stop for a connecting trip. The edge weights are just the time spent travelling or waiting, and an additional flag indicates whether using that edge means making a transfer, which is something we may want to minimize. This allows us to implement rules like minimum transfer times between pairs of routes (we talked about how this is missing in this demo), forbidden access or egress, and more esoteric features such as transfers that shouldn’t be counted as such, all by arranging the graph. The search algorithm stays the same: Find least-cost paths.
The functionality is part of our open source offering.
