Don’t hesitate to contact us:
Forum: discuss.graphhopper.com
Email: support@graphhopper.com
With the GraphHopper Isochrone API it is possible to create polygons of areas that you can reach from a certain location in e.g. 10 minutes for different modes of transport, like car or walking. This is useful for a number of purposes like finding the best location for a new supermarket or the valuation of a building area. Read more about Isochrone maps at wikipedia.
Polygons do not show the full details and so, over two years ago, I blogged about the possibility to show a much more detailed view of the underlying road network and reachability areas using our simple Java desktop UI. This was great and the possibilities are endless if you can print the detailed road network. Now, 2 years later, you can do this finally within the browser:
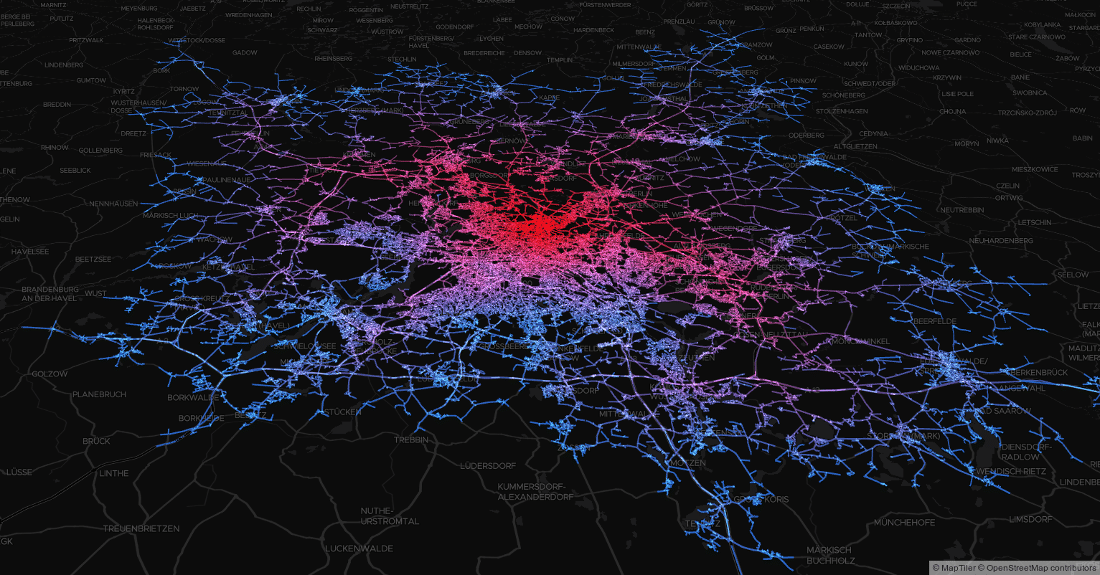
Reachable area started in Northern Berlin (the red area is close to the start)
To try this at home you can install a customized branch of our open source GraphHopper routing engine and set up this JavaScript client.
Update: Instead of a custom version you can use the /spt endpoint which is now officially included.
There are several things that were not obvious to implement. To make it easier for others I wrote down the problems and its solutions. Within this blog post you’ll learn about deck.gl, a bit about react JS and how to create animations like this (see below for more!):
Reachable areas of one hour for the different times of the day with different colors for different distances (blue = ‘far away’). Click to zoom.
You should clone the deck.gl repository and read a bit in the documentation in deck.gl but also about react JS. Finally copy one of the examples into a separate git repo to play around and run ‘npm start’. If you already have node or npm installed, it might be time to upgrade.
As the first step I wanted to display some road sections on the map. For that I had to call a web service and populate a data structure to finally update the map. As I’m a bit inexperienced with react I used a hack and I created a global variable that does a callback in the web service to call forceUpdate of the component. I need to find a bit time to rewrite this.
The proper way to do this is likely via Promise and applying the returned data via setState. I.e. without the need to call forceUpdate(). See this code.
To find out whether usage complexity and performance is really the best with deck.gl I tried Mapbox GL JS. The result was that for me it was easier to make it running (as it is based on leaflet) but it is much slower even for a static view and has no shiny third dimension fakeria.
Instead of the GeoJSON I also tried more compact binary edge formats and although it was more complicated to consume I kept using it because it is 5 times smaller and faster to load even through local network as for 1 hour areas this can get quite large 🙂
I was not able to create vector tiles out of the isochrone search (Mapbox Vector Tiles – mvt) which would have been really interesting but even the server-side the creation took too long (I used a library) and additionally I would have to split the isochrone edges into different tiles which felt unnatural.
To make this working I just added
pickable: true,
and increased the picking radius from 1 to 5 pixel via pickingRadius={5}
I’ll be honest with you: I love Mapbox maps and their investment into open source. Still, for several other reasons, I need to advertise alternative services and one of the promising stars at the map horizon is MapTiler Cloud.
Follow these 3 steps to replace Mapbox tiles usage within deck.gl:
mapStyle = 'https://free.tilehosting.com/styles/darkmatter/style.json?key=' + VT_TOKEN
There are a few possibilities to handle clicks, the only one that seems to work in my case was to use a surrounding div with the usual onClick and bind it to _onClickHandler. See this commit for the full details.
For the animation I borrowed some code from the TripsLayer and learned from this issue. Then I introduced a “time” state variable:
this.state = { /* your other state */, time: 0};
and created an _animate() method with code like:
this._animationFrame = window.requestAnimationFrame(this._animate.bind(this));
this.setState({time: convert(Date.now()));
In componentDidMount I added _animate() and in the layer I needed two things, with the first I specified which method will change with a time change:
updateTriggers: { getColor: time }
and the second thing includes the time variable:
getColor: d => d[2] < time ? getColor(d): [0, 0, 0, 0],
See here for the full commit and here the result.
Now how does the reachable area change over a typical weekday?
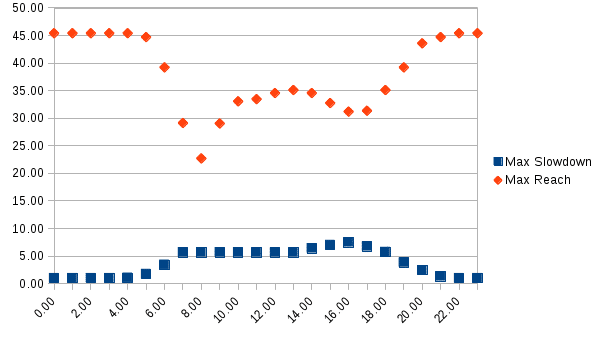
To find this out I fed GraphHopper with time-dependent TomTom data and calculated this area for every hour of the day. The area starts oscillating as shown in the animation above. We see the same behaviour for the maximum reached distance:
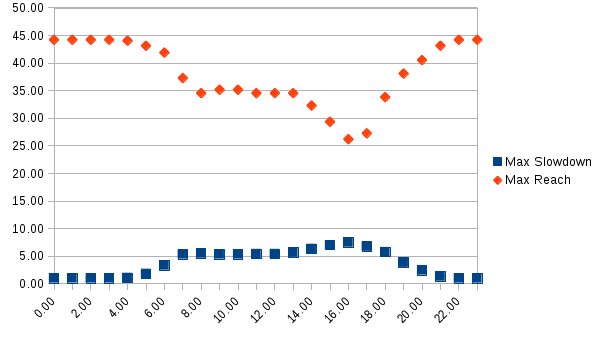
The orange dots show the maximum reached distance for a specific time of the day (00:00 to 23:00) and the blue dots show the maximum factor the speed was slowed down (speed at night / speed): for night this factor is obviously 1 but for extreme cases this can be 7.5 i.e. instead of like 50km/h cars travel with walking speed!
To highlight this within the reachability area I created an animation and color-encoded this factor (blue stands for 1 and red for bigger values). The result is interesting but not surprising:
Time dependent reachable areas (30min) with colors for different slowdown factors. Red roads mean that they are slower as its night speed. Click to zoom.
I wondered why there is no similar peak at around 08:00 like there is one for 16:00. My colleague Stefan pointed out the obvious: starting from the center and going out of the city should be much easier at 08:00 than going the opposite direction. I wanted to verify this theory and it gets solved if we use reverse_flow=true to calculate the reachable area where we now get a small maximum distance of 22.7km:
The reverse_flow=true shows a significant (negative) peak at 8:00 which comes from the fact that many people travel into the city at this time. Unlike for the previous chart where I calculated the “outgoing reachable” area and got a peak at 16:00 because many people want to leave the city.
The time-dependent reachable area shows the same at 08:00
Time dependent reachable areas (30min) with colors for different slowdown factors but with reverse_flow=true. Red roads mean that they are slower as its night speed. Click to zoom.
We showed how you can utilize GraphHopper and deck.gl to investigate and understand your road network data better. In recent development we will support isochrone calculation even for public transit to give city planners more options and tools to choose from.
deck.gl is already a mature project (only some minor limitations) which is very easy to use, a “looking good” default visualization and comes with a stunning performance where even graphics with millions of edges and nodes don’t burn your GPUs/CPUs.
